Results and Reports
Results
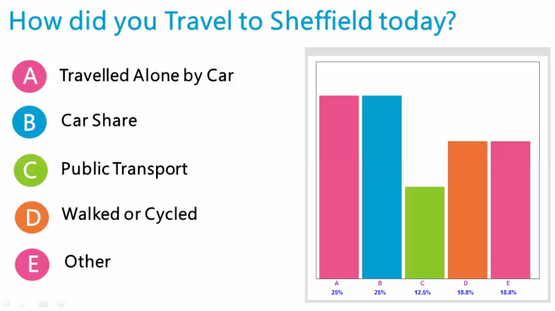
Live results to any question posed can be displayed to the audience once the voting has been halted.
The graph can be multi-coloured and matched to your organisations brand or left in single colour.
The latter is often used in a quiz format, most of the options showing blue with the correct answer shown in green.
Reports
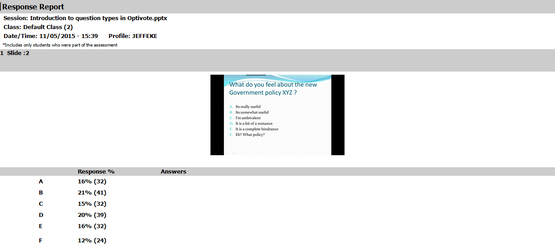
Post the event you will be supplied with reports on the voting activity.
These reports can be summaries of group voting activity or more in depth data depicting all votes cast by individual delegates.
You can match the individually coded handset to a delegate to gather their opinion, test their knowledge or monitor their progress. This option does, of course, conflict with the anonymous aspect
of voting enjoyed by many.