Question types
Optivote is capable of handling various question types including:
Yes/No
True/False
Multiple choice with up to eight answer options
Multiple choice with more than one correct answer possibility
Comparison graphs - to test the opinion shifts in your audience. Explored in
more detail below.
Comparison graphs can be used, for example, to determine the shift in audience opinion during your event. A question is posed to guage opinion early in the day and the same question posed again
later in proceedings.
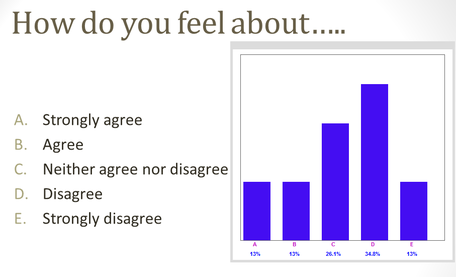
BEFORE
This sample question was posed in the early stages of a conference and the results graph shared with the audience.
The opinion here is edging towards the "Disagree" so the challenge during the event was to shift that opinion to the left.
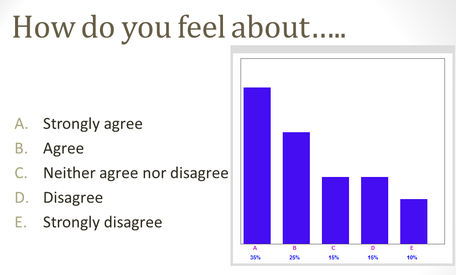
AFTER
The same question was posed later in the day and the results look more promising.
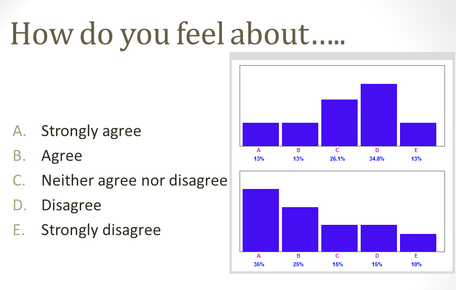
COMPARE
Once the operator calls up the previous graph a direct comparison can be made between the two. Both the presenter and the delegates can see here the shift in opinion to a more "agree"
stance.